Aerodynamic and Hydrodynamic Applications
Aerodynamic and Hydrodynamic Applications
The strut end-wall flow is a simple experimental setup that produces a widely recognized but complex flow field. This flow field includes a two dimensional skin friction field along with stagnation points, re-circulation zones, and pressure gradients. The strut end-wall tests were conducted by mounting a cylinder along the edge of a 19-mm diameter plug with a 1-mm deep cavity that was filled with S3F. The diameter of the cylinder was 5-mm and the length was approximately 50-mm. The plug was mounted in the lower wall of the test section with the film downstream of the cylinder and data were acquired at several velocities up to 3.1 m/s using exposure times of 20-ms. The plug was then rotated so that the cylinder was located downstream of the film and the test conditions were repeated. Data from the upstream and downstream test configurations were combined to provide a full representation of the flow around the strut.
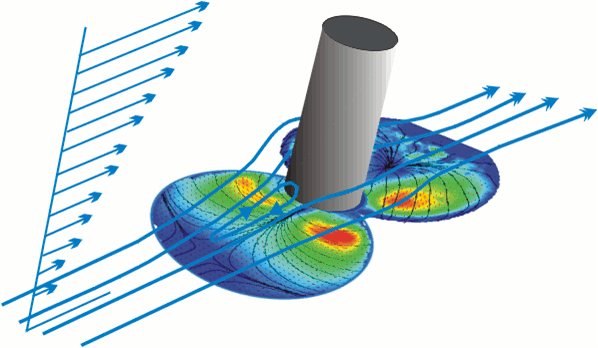
The tangential displacement field is represented using vectors to show both magnitude and direction, and the color contours represent normal deformations of the film. The location of the upstream junction vortex is apparent in the tangential displacement vectors. These contour lines illustrate the curved geometry of the junction vortex as it wraps around the strut and provides an estimate of the upstream displacement of the vortex core from the leading edge of the strut. The low free stream speed produces a large junction vortex that does not tightly wrap around the cylinder as depicted by the direction of the contour lines. The stagnation point is clearly located on the upstream side of the cylinder and regions of increasing shear are present as the flow accelerates around the cylinder.
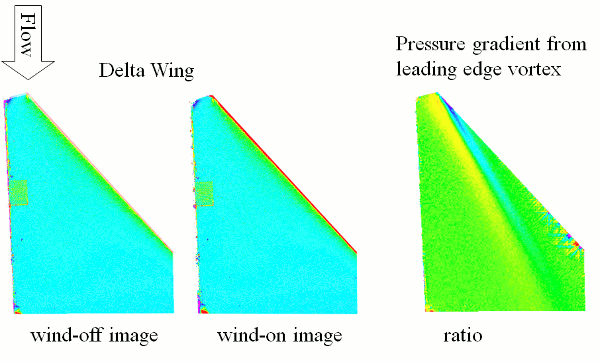
A delta wing was prepared with a thin, sprayed S3F film and the film was splattered with a high-contrast fluorescent probe. The delta wing was placed in the ISSI wind tunnel at a 5-degrees angle of attack and data was acquired using a 5-Megapixel CMOS camera. The raw and processed data is presented in the Figure. The leading edge vortex pair is clearly visible in the processed data. The operating distance in this case was several feet, the field of view was about 6-inches square, and the exposure time was 1-ms. A finale issue that is of significant interest is that the camera used to acquire this data was an inexpensive USB camera (less than $700). It is not necessary to acquire an expensive scientific grade camera to use S3F for skin friction measurements.
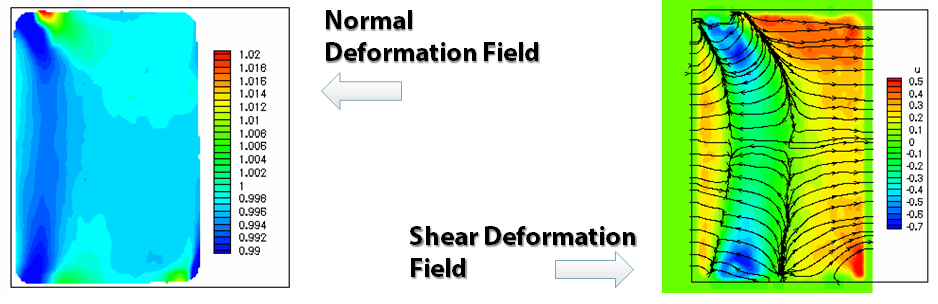
A demonstration of the S3F on a well known flow field is provided using a NACA 0012 airfoil at low speed. The NACA 0012 has a well known laminar separation bubble near the leading edge. The airfoil was fabricated with a 1-mm deep cavity near mid-span that wraps around the leading edge. A 1-mm thick S3F film was cast on a Mylar film and glued into the cavity. The goal of this film application process was to preserved the structure of the airfoil. The airfoil was placed in a wind tunnel and illuminated using an LED array. Data was acquired at several angles of attack and the results for 12 degrees angle of attack at 10 m/s are shown in the Figure. The normal and tangential deformations along the chord of the airfoil was extracted and converted to pressure and skin friction. The shear field indicates the region of recirculation near the leading edge. The pressure distribution shows the favorable pressure gradient from the leading edge. Data from a series of pressure taps was compared to the S3F pressure data and the agreement between the S3F and pressure taps was about 2-Pa.
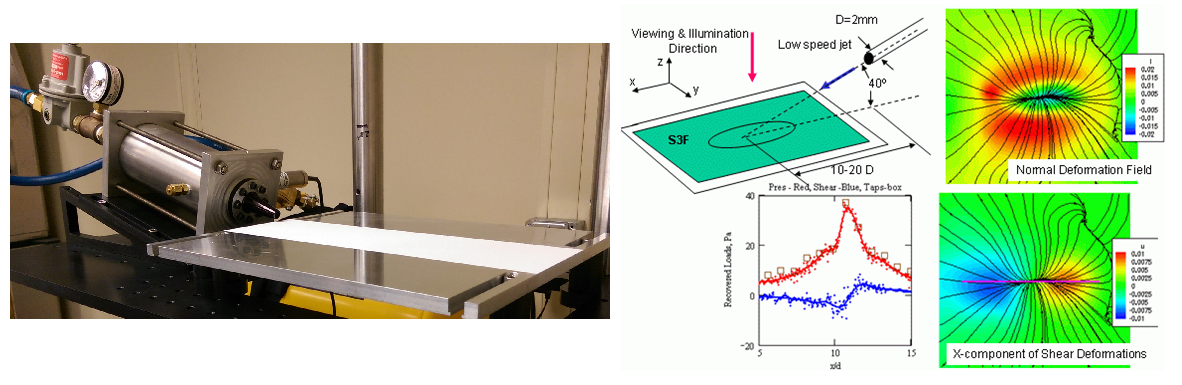
To demonstrate the accuracy of the S3F system for measurements of small aerodynamic forces, a jet impingement experiment was performed. A jet with a 2-mm nozzle was positioned so as to impinge on a flat surface at an inclined angle. Data was acquired the normal and tangential deformations of the S3F are shown in the Figure. The normal and tangential deformations along a line parallel to the jet (indicated in the Figure) were extracted and these data were converted to skin friction and pressure measurements. The pressure measurements are compare to results obtained using pressure taps in the Figure. This jet was operated at a low speed and the maximum pressure on the surface was 40 Pa. The deviation between the S3F data and the pressure taps is less than 2-Pa or 5% of the full scale pressure. The spatial resolution of the S3F is evident; in this case it is about one-tenth of a jet diameter or 0.2-mm. Generally speaking, this spatial resolution is on the order of about 1/5 the film thickness (which can be as small at 0.1-mm). Finally, the skin friction data indicate a region of zero shear (a stagnation point) and flow reversal upstream of the location of maximum pressure. Downstream of the stagnation point, the skin friction is along the major axis of the jet. Quantitative comparison of the skin friction data was not possible.
To evaluate the quantitative accuracy of the S3F, an experiment was performed using a fully developed channel. The fully developed channel flow provides an excellent environment for validating the S3F sensor for skin friction measurements. The skin friction in the channel may be determined experimentally by monitoring the pressure gradient or theoretically by monitoring the Reynolds Number and using the Poiseuille flow relation.
The channel is created using a cavity of 150-mm length by 24-mm width by 1.72-mm depth. The acrylic cover plate includes two ports for air inlet/outlet as well as two ports for monitoring the pressure gradient about 150 channel heights (h) downstream of the inflow port. The film is imaged in the region between the pressure ports. Data was acquired at several flow rates and the flow rate was set using a mass flow controller, and therefore, the Reynolds Number could be determined. Data was acquired using two relatively thick films (~300-micron) of shear modulus 312-Pa and 3035-Pa.

The S3F and pressure gradient skin friction measurements are plotted versus Reynolds number in the Figure, along with the Poiseuille flow relation. The skin frictions in this Figure range from 0.5-Pa to 70-Pa. The pressure gradient, Poiseuille flow, and S3F skin friction measurements are in good agreement (better than 5% full scale) over the range of skin frictions encountered in this flow. These results demonstrate that the S3F can be used for quantitative skin friction measurements.
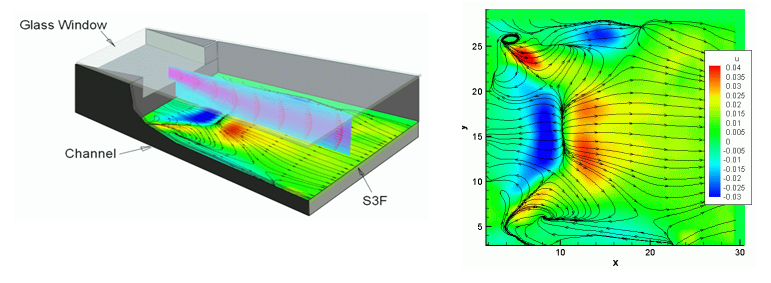
One focus of the S3F program is to develop a small packaged sensor for 2D point measurements of skin friction, ideally with a frequency response of several kHz. This type of package could be deployed for wind tunnel, water tunnel, or field testing (in flight or at sea). An early evaluation of this type of point sensor for skin friction measurements was conducted in a high Reynolds number boundary layer at the Penn State University 12-inch water tunnel.
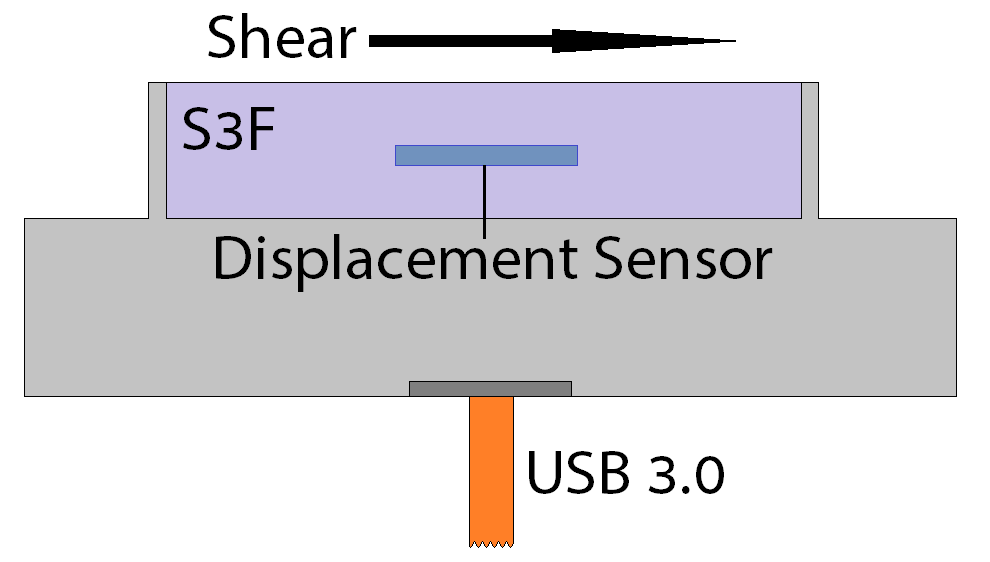
The prototype 2D point sensor on which the measurements were conducted was designed to fit in an existing test-section window on the 12-inch water tunnel. The window was designed with a 76-mm diameter hole to receive the sensor package which includes the S3F, illumination source, and imaging system. The S3F cavity is 30-mm in diameter and 1-mm deep. The cavity is formed by machining a hole through the center of the plug and mounting a window 1-mm below the surface to form the bottom of the cavity. Behind the window, several LED’s are used to illuminate the S3F and a small USB-based CCD camera is used to monitor the deformations of the film surface.

The tunnel velocity was then set to 4-m/s and data was acquired at 2-m/s increments up to a speed of 12-m/s (Reynolds Number 2-6 million). Each image was cross-correlated with the flow off image and the 2D tangential displacement was determined and converted to skin friction. The results are plotted versus the skin friction measured using a drag balance in Figure. The drag balance data was confirmed by performing Laser Doppler Velocimetry profiles in the boundary layer above the S3F sensor. The S3F sensor results are in relatively good agreement with the accepted drag balance result. The root mean square deviation between the data sets is less than 5% of the full scale value of skin friction measured by the drag balance. The accuracy of the data from the sensor can be improved by using several data points to produce an in-situ calibration for the sensor. This corrected data is also shown in the Figure. This need for an in-situ calibration is believed to be related to the accuracy with which the shear modulus and thickness of the stiff films can be measured. Improved techniques for measuring these quantities are under development.
For ordering information please contact our sales department: [email protected] or call us at (937) 630-3012
For technical support, please contact our support department: [email protected] or call us at (937) 630-3012
2026 © Innovative Scientific Solutions, Inc.